Interpretation of Electrical Test Data with Regards to Microwave Cable Assemblies
Prepared By: Dave Slack
Originally published in RF Globalnet
June 3, 2002
A cable assembly provides two essential functions in a microwave or RF system.
These devices serve to mechanically connect an RF source to its load and to serve as a propagation medium and waveguide for the RF signal.
A cable assembly should not be considered as hookup wire. It is a passive, TEM mode, microwave device. As such, they are system components whose performance is just as important as directional couplers, combiners or antennas or a host of other passive microwave components.
Cable assemblies are an integral part of the microwave system and their performance is critical to overall system performance. To ensure that the cable assembly being considered for use in a given system will perform well several measurements of electrical performance are commonly made.
The primary measurement parameters used when evaluating microwave cable assemblies are Voltage Standing Wave Ratio (VSWR) and Insertion Loss. These are commonly referred to in quantitative terms where specifications such as VSWR of 1.4:1 maximum and insertion loss less than 1.5 dB.
While these numerical quantities are of great importance, especially when making a pass-fail judgment, they do not tell the whole story.
When attempting to understand why a cable assembly is not meeting its quantitative requirements it is enormously valuable to understand the qualitative features of the insertion loss and VSWR
characteristics.
A quick glance at an insertion loss and VSWR plot can yield an abundance of understanding with regards to a cable assembly’s fitness for use.
When a load is connected directly to a source most of the power delivered by the source will be transferred into the load.
In situations where the source and load cannot be co-located the load may then be separated from the source with a cable assembly “inserted” in between them. The amount that the power delivered to the source is reduced is called the “insertion loss”. This is the loss of power due to inserting the cable between the source and the load.
There are three primary factors contributing to overall insertion loss. These are the attenuation of the cable, attenuation of the connectors and the mismatch loss due to imperfect impedance matching.
Attenuation of cable and connectors are functions of their respective material and geometric properties.
Some of the factors affecting attenuation are:
- Conductivity
- Surface finish
- Dissipation factor
- Propagation Velocity
- Line Size
- Impedance
- Frequency
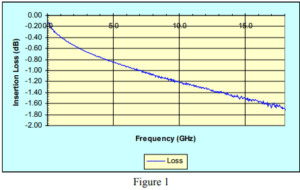 Figure 1 depicts a typical insertion loss vs. frequency plot of a coaxial cable assembly.
Note that the fine grain ripple on the graph becomes more pronounced as frequency increases. This is due to the mismatch loss that is a result of less than perfect impedance matching and will be discussed later.
Total insertion loss is the sum of connector loss, cable loss and mismatch loss.
VSWR
The theorem of maximum power transfer states that the most efficient transfer of energy will occur when load impedance matches that of the source delivering the power.
A 50 ohms source, connected to a 50-ohm load through a 50-ohm transmission line will be the most efficient system from a transfer of energy standpoint.
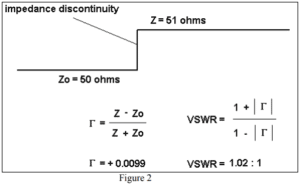 In a practical system all of these impedances are not exactly matched. At the point where two unequal impedances meet a discontinuity is created. This discontinuity causes some of the power to be reflected back from the discontinuity with the balance being transferred forward.
This discontinuity can be quantified in terms of reflection coefficient. Once the reflection coefficient of a discontinuity is quantified the Voltage Standing Wave Ration (VSWR) can be calculated. This is a measure of the reflected voltage and ultimately, of the reflected (and transmitted) power.
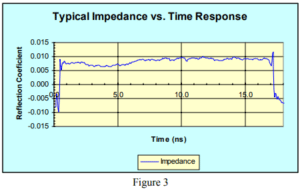 Figure 2 illustrates a very simple case of a perfect system containing one, very simple discontinuity. A realistic system is composed of a virtually infinite number of cascaded discontinuities.
Reflection coefficients are complex quantities containing both magnitudes and phase angles. The composite system makes up an array whose vector sum yields the composite VSWR vs. frequency response of the system. Figure 3 illustrates impedance vs. time of a typical cable assembly.
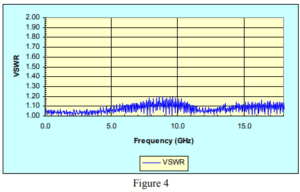 Figure 4 illustrates the VSWR vs. Frequency plot of the cable assembly whose impedance characteristics is illustrated in figure 3.
Return Loss is another way of understanding the relative impedance match (or effectiveness of power transfer) of a cable assembly. Return loss is the ratio of power reflected to power delivered and can be calculated as follows:
Return Loss (dB) = 20 log l Γ l
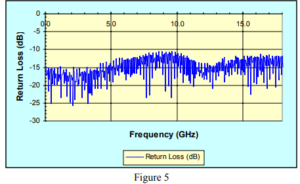 The return loss vs. frequency graph of the above assembly is shown in Figure 5.
A VSWR plot, to the uninitiated, can be a very confusing plot. One is tempted to seek the maximum value and make a “pass / fail” decision based on this value. In reality there is a wealth of information contained within this presentation.
A cable assembly, in its simplest sense, is a relatively uniform impedance cable with two connectors installed on both ends. Each of these connectors typically has impedances that are slightly different than the cable and probably slightly different than either the source or load. These connectors are separated be the signal propagation time, or electrical length of the
assembly.
A standing wave pattern created by these two connectors will be a function of the magnitude and phase angle of the two connector reflection and the electrical length separating them.
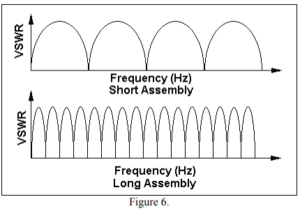 As frequency is incremented from lowest to highest operating frequencies the phase angle of the two reflection coefficients, in relation to each other, also varies. If the swept frequency band is wide enough the two interacting reflection coefficients will be in phase at some frequencies and out of phase at some frequencies.
When the relative phase angle is zero degrees the two magnitudes will algebraically add and VSWR will be at a maximum. When the relative phase angle of the two are 180 degrees out of phase the two, equal magnitude, reflection coefficients will subtract and VSWR will be minimum. If the magnitude of the two reflection coefficients are equal they will cancel each other completely at frequencies where they are 180 degrees out of phase.
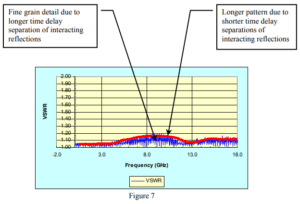 When cable assemblies are longer the propagation delay is longer. This causes the frequency differential between the peaks and nulls to become smaller. For a short assembly the VSWR vs. Frequency plot has a long period to it and represents a rectified sine pattern. As the assembly becomes longer the VSWR pattern takes on a fine grain “ripple” effect.
As the cable assembly deviates from this simple model towards a more practical model the VSWR pattern becomes more complex. The individual parts of a connector will interact with each other. The time delay between these parts is small. This causes a fine grain VSWR to be superimposed on a long flowing pattern.
Termination Problems
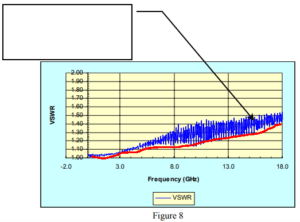 When the two primary reflections (usually the connectors) are equal, or close, in reflection coefficient magnitude the VSWR maximums will be low and the VSWR minimums will be very close to unity.
This canceling effect is usually not complete because of the attenuation of the cable. This is why a complete canceling may occur at lower frequencies and become less complete as frequency increases.
When the VSWR nulls significantly deviate from 1.0:1 VSWR it is indicative of a problem with one of the connectors. It is letting us know that the reflection coefficient magnitudes of the two connectors are no longer close to being equal.
This can be caused by high resistance contact points within the connector, poor solder quality, or a high reactive impedance mismatch caused by an incorrect dielectric.
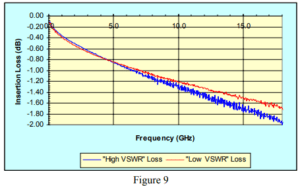 Figure 9 illustrates two separate assemblies. One having a high VSWR and the other having a normal VSWR.
The high VSWR assembly is slightly longer in length (and higher in loss) such that their respective curves do not overlay each other. From the quality of the curves the effect of the high VSWR on insertion loss is readily apparent.
The fine grain ripple due to mismatch loss that is superimposed on the attenuation curve is much greater on the high VSWR assembly.
“Suckouts”
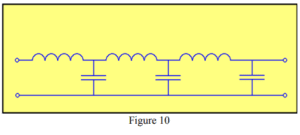 For purposes of theoretical analysis transmission lines are commonly modeled using lumped constant parameters. The distributed capacitances and inductances are lumped into discrete components from which transfer functions and other mathematical tools may be derived.
The lumped constant model of a coaxial transmission line is that of a multi pole, low pass filter as shown in Figure 10.
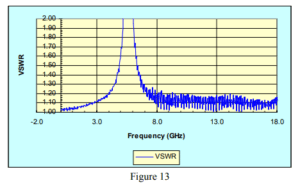
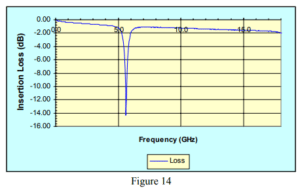
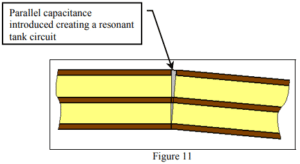 For a coaxial system to work properly all of the mechanical mating parts must have complete contact, throughout 360 degrees of circumference of the inner and outer conductors. When parts are not correctly assembled, or not mated with sufficient contact pressure, this 360-degree contact is not maintained and a resonance can result.
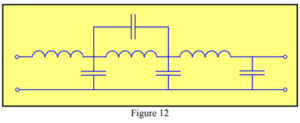 The resultant lumped constant model is illustrated in Figure 12. A parallel LC tank, at resonance, presents very high impedance. This causes the transmission line model to have a band stop characteristic that is not desirable in most applications.
The center frequency and bandwidth of the band stop characteristic is a function of the degree of separation severity of the mismatched parts.
The effect on insertion loss and VSWR are illustrated in Figures 13 and 14.
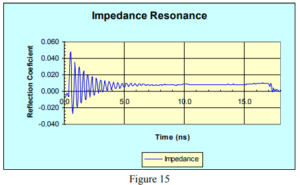
The effect can be further noted when viewing impedance vs. time (distance) plot of an assembly having mismated or loose parts. Fig 15. It is evident upon inspection of the plot that the input connector displays significant “ringing” that is typical of a resonant condition.
Impedance Uniformity (structural return loss)
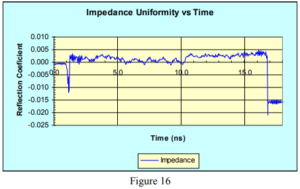 Until now we have been considering the cable part of a cable assembly to be of uniform impedance. We have considered the connectors, and their interactions, to be the cause of the VSWR effects. In most cases the connectors are the primary contributor to VSWR and the cable is the primary contributor to insertion loss. There are cases where, for a variety of reasons, the cable impedance uniformity is less than perfect. This is illustrated in Figure 16.
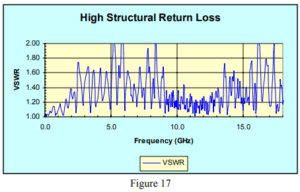 These sorts of “structural” discontinuities yield a non-uniform, non-repetitive VSWR pattern. This type of pattern is typically referred to a high structural return loss as illustrated below.
Cable Spikes
When impedance discontinuities are very repetitive and consistently spaced there will be a specific frequency where all of these repetitive discontinuities will add. At this frequency a very magnitude, narrow band VSWR characteristic can be created.
This phenomena is commonly known as a “cable spike”. The larger the discontinuities, the more consistent the spacing, and the longer the amount of cable affected the larger the cable spike can become.
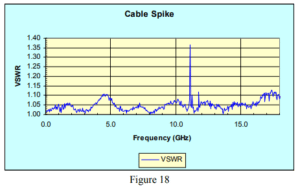
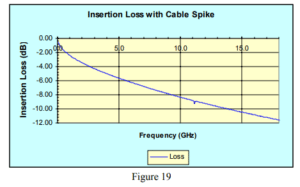
This can be an especially frustrating problem in the manufacture of cable for use at microwave frequencies. These cables are typically quite broad band so that any tendency to have a cable spike will most likely occur somewhere within the operating band of the cable.
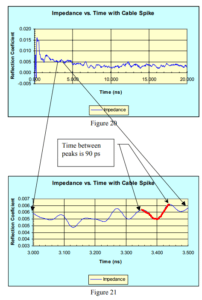 Most of the operations employed in the manufacture of cable involve rotating machinery. The repetitive nature of rotating machinery is often the cause of cable spikes. Through the use of quality machinery, diligent maintenance and active quality control measures the spike problem can be effectively eliminated.
Figure 20 illustrates the impedance plot of the cable spike assembly. Figure 21 is a close up showing the fine impedance discontinuities and their repetitive nature. A period of 90 pico seconds causes the 11.1 GHz spike noted in Figure 18.
Modeing
A coaxial cable assembly is designed to operate in a Transverse Electro – Magnetic (TEM), or coaxial mode. In a TEM wave both the electric and magnetic fields are at right angles (transverse to) to the direction of travel.
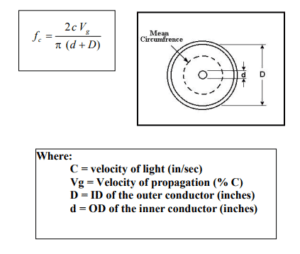 The coaxial structure will not support various “wave guide” modes of operation as long as the half wavelength of the signal being propagated is less than the mean circumference of the coaxial structure.
These higher order modes allow circulating fields to exist that are in a direction not transverse to the direction of propagation. These circulating currents absorb energy that is no longer available to be transferred to the intended load. These currents tend to be unpredictable and unstable and are generally not desirable.
The maximum operating frequency, that is free of TE or TM modes, is referred to as the frequency of cutoff (fc). This is illustrated below.
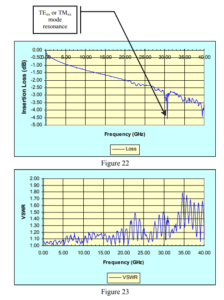
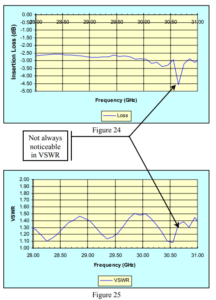
A VSWR and insertion loss plot of a cable assembly operating beyond its cutoff frequency is shown in Figure 19 and 20.
Figures 24 and 25 are a 3 GHz section of Figures 22 and 23. These serve to illustrate that, unlike a cable spike, the effects of operation beyond cutoff are not always evident in the VSWR plot.
Dents
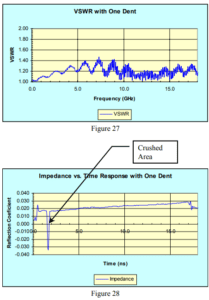
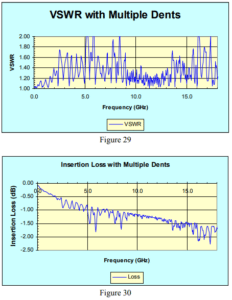
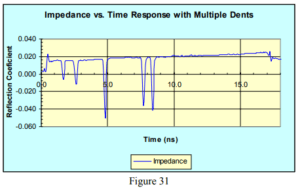
 One of the more common causes of failure of a cable assembly is for the cable to become crushed or dented. Cable impedance is a function of geometry and propagation velocity of the dielectric core. This can be calculated as follows:
 Where Zₒ is the impedance, Vg is the velocity of propagation, D is the outer conductor diameter and d is the center conductor diameter.
When the cable is crushed or dented the outer diameter (D) is reduced and the Vg is also reduced. This lowers the impedance and causes an impedance discontinuity.
The following series of figures illustrates the effects on impedance and VSWR when a good assembly has dents imparted into it.
Contamination Ingress
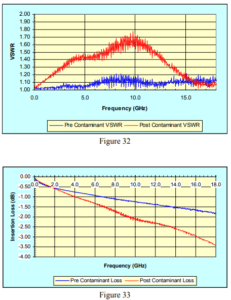 Another common failure mode is that of contamination ingress into the dielectric of the cable structure. This can be caused by compromise of the vapor seal of the cable assembly or by the use of solvents or other aromatic materials during the manufacture of the cable assemblies.
This failure manifests itself in the form of lower impedance where, the core is contaminated, as well as an increase in insertion loss by more than the increased mismatch loss would normally indicate.
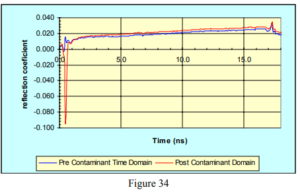 If the contamination ingress is due to solvents used in the installation of the connector the impedance discontinuity will be evident at the beginning of the cable assembly as shown in Figure34.
The contamination may also enter the cable through a puncture or tear in the vapor barrier of the cable. In this case the impedance discontinuity would appear in proximity to the leak.
Conclusion
With a discerning eye towards the qualitative presentation of cable assembly test data, the discriminating consumer of these products can easily, and quickly, identify the most likely cause of cable assembly problems.
Once the most likely cause is identified the real work of implementing root cause problem solving techniques and practices can begin.
Subscribe to our newsletter!
Interested in receiving email newsletters and other updates from Times? Subscribe now!
